Web Performance
& CRO Strategy
Unlocking hidden revenue through speed optimization, user experience refinement, and data-driven conversion funnels.

Key Metrics
High-level performance indicators for the last 30 days.
Industry standard CVR for footwear & apparel e-commerce. Your actual CVR will be baselined once tracking is live.
LCP is 17.5s on mobile. Google recommends under 2.5s. Every second of delay costs ~7% in conversions.
Industry avg for apparel is 68-72%. Speed and checkout friction are the biggest drivers.
Above the 40-45% industry avg for apparel. A 17.5s load time is driving users away before content even renders.
Executive Summary
We identified four critical bottlenecks preventing scale. Here's what's costing you revenue — and what to fix first.
Site Speed & Core Vitals
- Lighthouse Performance score: 22/100
- Render-blocking requests wasting 840ms
- CLS at 0.588 (threshold: 0.1)
Fixing speed alone can lift conversions by ~8-10%
Checkout Friction
- No trust badges or security signals
- Hidden shipping costs until checkout
- No free shipping threshold visibility
Slide-out cart with shipping progress bars will capture lost intent
Mobile UX Architecture
- "Add to Cart" button below the fold
- Thumb zone completely ignored
- Email popup fires immediately, causing bounces
Sticky ATC + exit-intent popup will reduce PDP bounce by 15-20%
Product & Collection Page UX
- Collection pages show 32 team names — no product images
- Users must scroll past text wall to see products
- PDP lacks trust badges and urgency elements
Visual collection grid + trust signals will lift CVR by ~1.2%
Revenue Opportunity
Every friction point we identified is a revenue lever. Here's what the research says about fixing them — and why A/B testing is the lowest-risk way to unlock growth.
Sticky Add-to-Cart Bar
A/B TestMobile users never see the ATC button without scrolling. A persistent sticky bar keeps the purchase action always accessible — proven to lift ATC rates significantly for mobile-heavy stores.
Exit-Intent vs. Immediate Popup
A/B TestCurrent popup fires on page load, causing 40-60% of users to immediately dismiss or bounce. Exit-intent triggers only when users show leaving behavior — capturing more emails with zero conversion friction.
Visual Collection Grid
Redesign + TestReplace the text-only team list with product image cards, prices, and quick-shop CTAs. Visual merchandising above the fold is the #1 driver of collection-to-PDP click-through in apparel e-commerce.
Free Shipping Progress Bar
A/B TestA dynamic progress bar in the slide-out cart ("You're $15 away from FREE shipping!") creates a psychological commitment loop. Top Shopify brands using this see measurable AOV lifts within weeks.
Why A/B Testing?
Don't gamble on redesigns. Test, measure, scale what works.
of A/B tests reveal insights that contradict assumptions
Even experienced teams guess wrong more often than right. Testing removes opinion from the equation.
ROI on every $1 spent on CRO testing
Unlike ad spend, conversion improvements compound. A 1% CVR lift this month keeps paying forever.
average revenue lift from a structured testing program
Brands running 2-3 tests/month see double-digit growth without increasing traffic spend. Same visitors, more revenue.
Technical Audit
Deep diagnosis of codebase health, speed, and integrity.
Lighthouse Report
Mobile AuditCore Web Vitals
- First Contentful Paint6.2s — far above the 1.8s threshold. Users see a blank screen for too long.
- Largest Contentful Paint17.5s — catastrophic. Google recommends under 2.5s. Hero image and render-blocking resources are the culprits.
- Total Blocking Time490ms — yellow zone. Third-party scripts and synchronous tracking pixels are blocking the main thread.
- Cumulative Layout Shift0.588 — extremely high. Google threshold is 0.1. Elements are shifting aggressively during load.
- Speed Index10.1s — content is painting too slowly. Needs image optimization and critical CSS inlining.
Lighthouse Insights
- Render Blocking RequestsEst savings of 840ms. CSS and JS files are blocking first paint.
- Legacy JavaScriptEst savings of 45 KiB. Polyfills being served to modern browsers.
- Inefficient Cache LifetimesEst savings of 77 KiB. Static assets missing proper cache headers.
- Layout Shift CulpritsElements shifting during load — causing CLS of 0.588.
- Forced ReflowScripts are forcing the browser to recalculate layout mid-render.
Loading & Delivery
- LCP BreakdownLargest paint element is severely delayed by render-blocking resources and slow server response.
- LCP Request DiscoveryThe LCP resource is not being discovered early enough in the loading waterfall.
- Network Dependency TreeDeep chain of dependent requests is delaying critical resource loading.
- Improve Image DeliveryEst savings of 132 KiB. Images need modern formats (WebP/AVIF) and proper sizing.
- Excess PreconnectsMore than 4 preconnect hints found. Should be used sparingly for critical origins only.
Conversion Funnel
Identifying where user intent is leaking.
Collection → Product Page
Collection pages display a wall of 32 NFL team names with zero product images above the fold. Users must scroll past the entire team list before seeing any products. No visual merchandising or featured products to drive clicks.
Product Page → Add to Cart
An email capture popup fires immediately on load, obscuring content and driving bounces before users even see the product. We recommend exit-intent only. PDP also lacks trust badges and urgency elements, and the 'Add to Cart' button is below the fold on mobile.
Cart → Checkout
Users are price-checking. No free shipping threshold visibility in the cart. Lack of trust badging and hidden shipping costs are killing motivation to proceed.
Checkout → Purchase
Guest checkout option is buried behind login prompts. Express payment options (PayPal, Apple Pay) need better prominence to reduce friction.
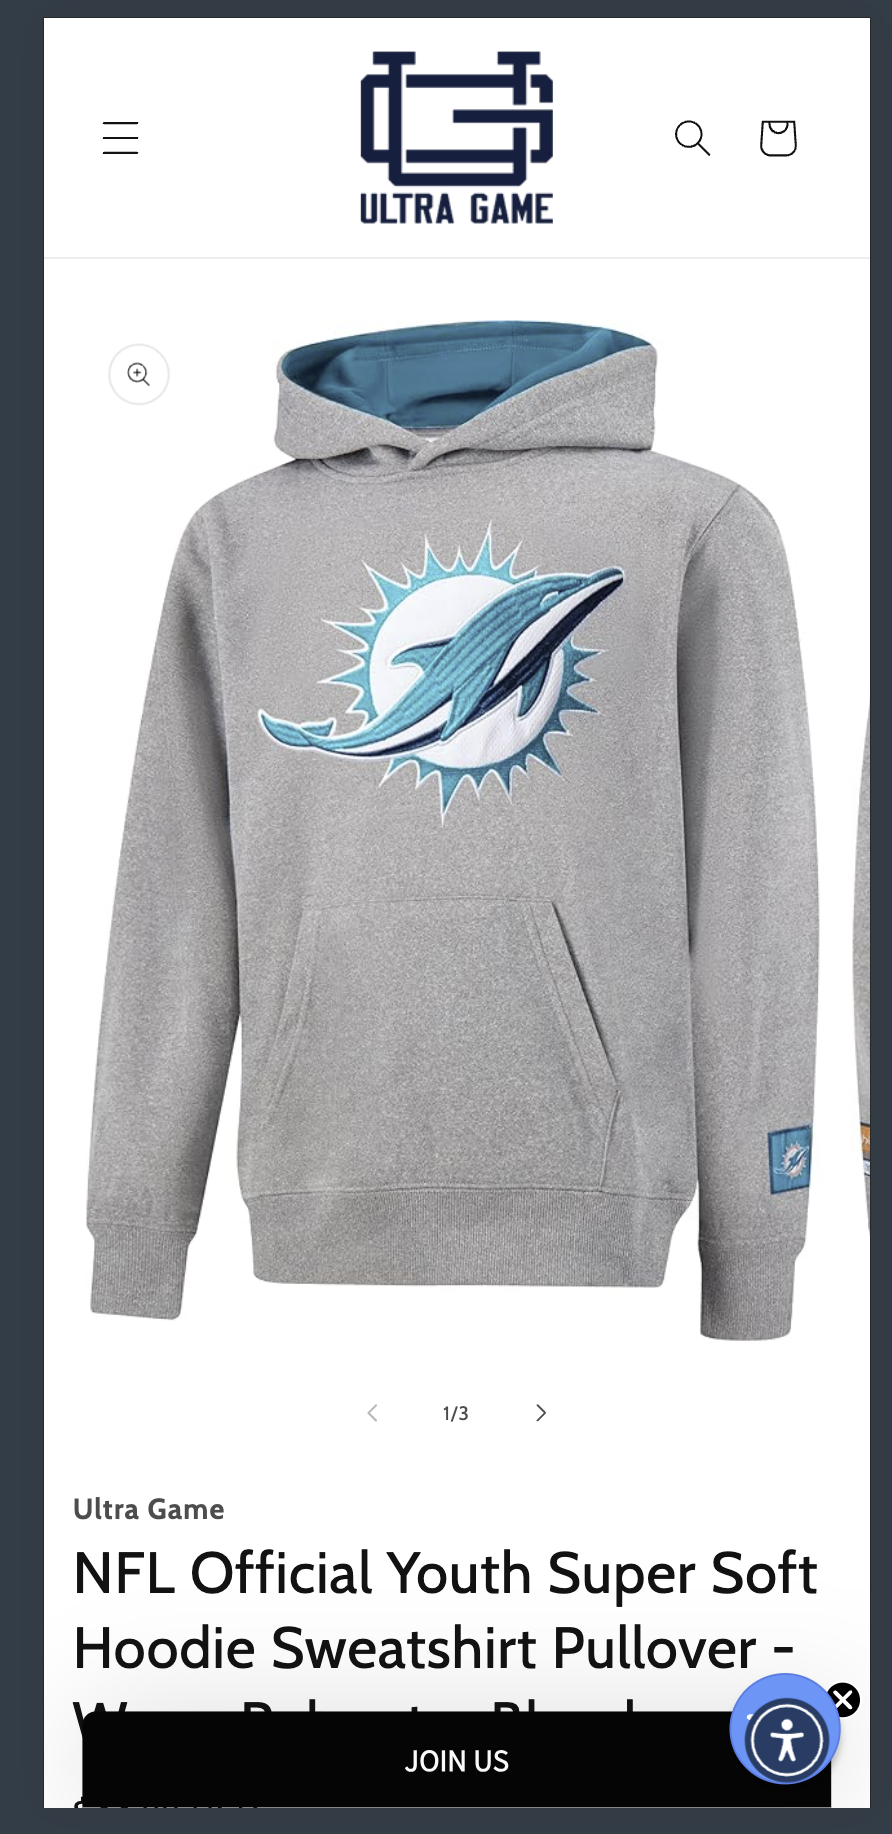
Email popup fires immediately on load, obscuring the product and "Add to Cart" button. No trust badges visible. CTA is pushed below the fold.
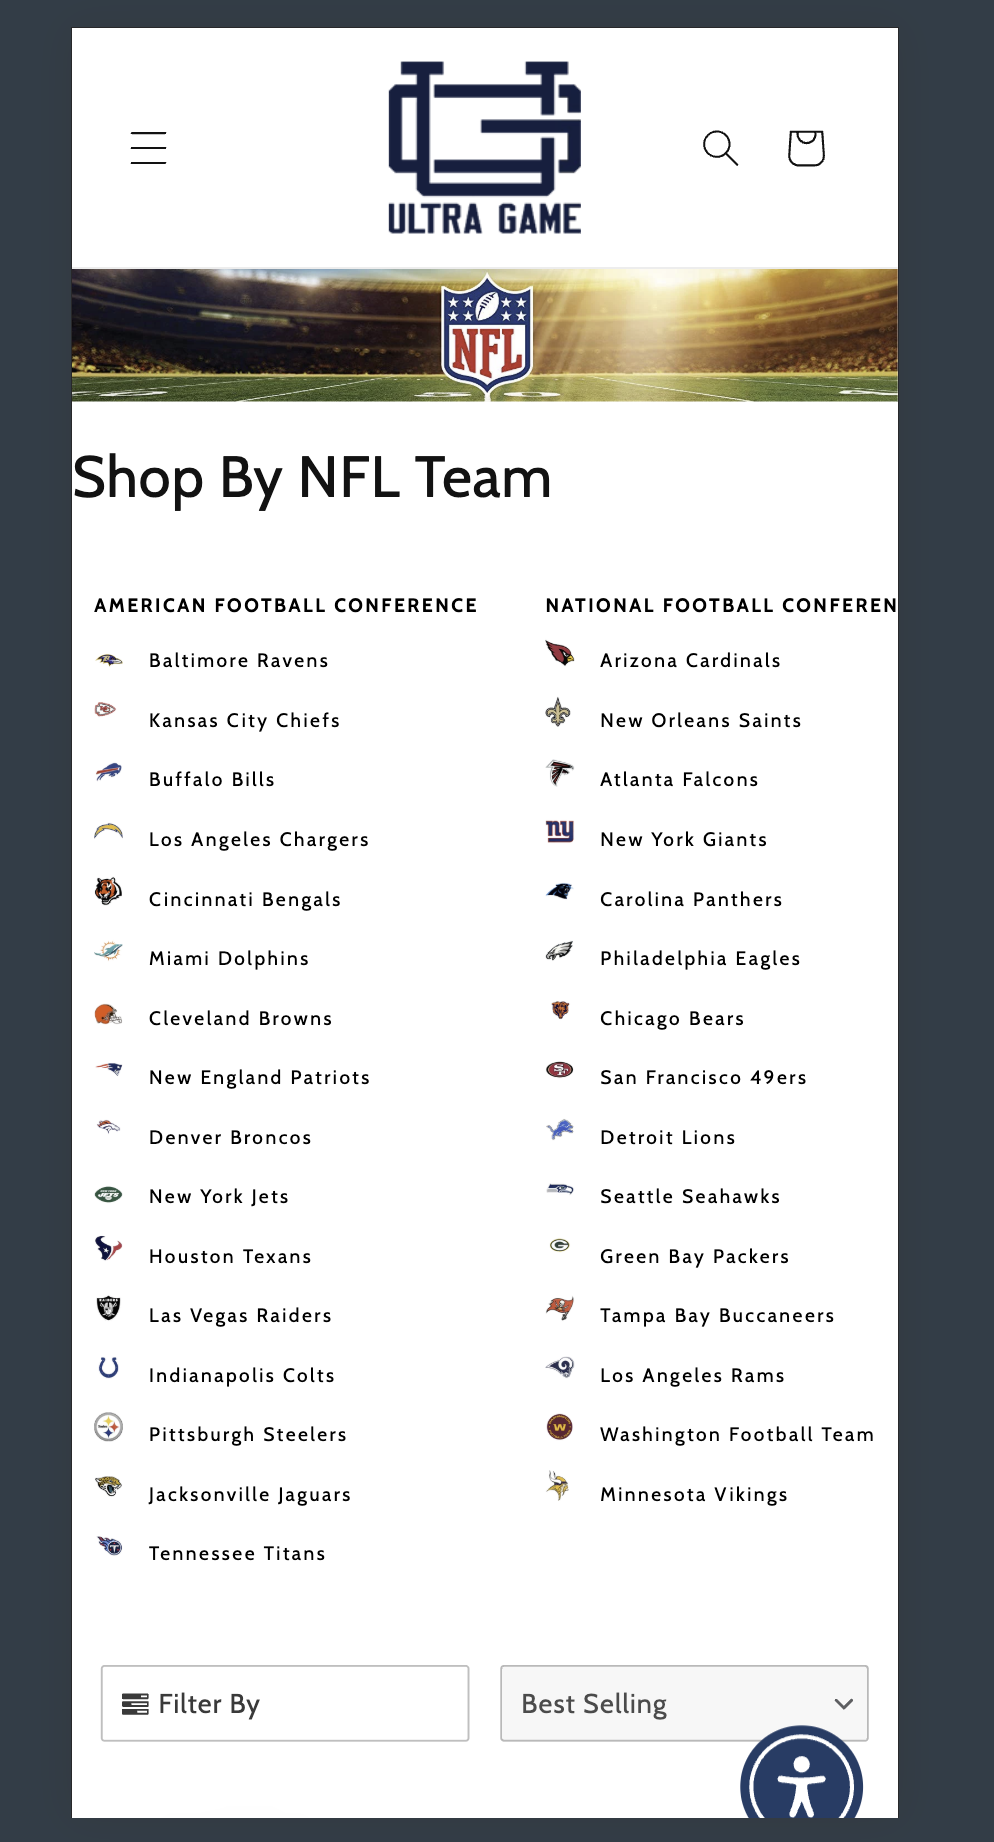
32 NFL team names listed as plain text — zero product images above the fold. Users must scroll the entire list before discovering any products.
The "Sticky ATC" Opportunity
Implement a sticky "Add to Cart" bar on mobile PDPs so the primary CTA is always visible. Switch the email popup from immediate to exit-intent only, and add trust badges and urgency elements to reduce PDP drop-off by 15-20%.
Collection Page Redesign
Replace the text-only team list with a visual grid showing product images, prices, and "Shop Now" CTAs. Feature best-sellers above the fold. The current layout forces users through an extra click just to see what's for sale.
Strategic Redesign: The Foundation for Growth
Before iterating with A/B tests, we recommend establishing a high-performance baseline. Moving to a premium Online Store 2.0 Shopify theme will immediately resolve 80% of the technical and UX debt identified in this audit.
Visual Merchandising Engine
Transform collection pages from text lists into shoppable, image-rich grids. Enable "Quick Add," color swatches, and badging (New, Best Seller) directly on product cards to lift click-through rates.
Mobile-First Architecture
Native sticky "Add to Cart" bars, thumb-friendly navigation, and streamlined checkout flows designed specifically for the 80% of your traffic on mobile devices.
Performance by Default
Modern OS 2.0 themes use rigorous code splitting and native image optimization. Expect LCP to drop from ~17s to <2.5s simply by migrating to a cleaner codebase.
Why Redesign First?
- Cost Efficiency: Fixing individual issues (speed, layout, mobile UX) piecemeal costs more than implementing a holistic theme solution.
- Clean Data for A/B Testing: Testing on a broken foundation yields noisy data. A clean redesign provides a stable baseline for meaningful optimization.
- Brand Perception: Immediate elevation of brand trust through professional, cohesive aesthetics that match the quality of your NFL partnerships.
Recommended Theme Class
Premium OS 2.0 (e.g., Prestige, Impulse)
A/B Testing Roadmap
Prioritized experiments to drive incremental growth.
| Experiment | Hypothesis | Est. Impact | Complexity |
|---|---|---|---|
Sticky Add-To-Cart | Keeping the CTA visible on scroll increases mobile conversion. | High | Medium |
Exit-Intent Popup | Replacing immediate email popup with exit-intent reduces PDP bounce rate by 15-20%. | High | Low |
Collection Page Visual Grid | Replacing text-only team list with product image grid lifts collection-to-PDP click-through. | High | Medium |
Cart Drawer Upsell | Offering complementary products in-cart (pre-checkout) boosts AOV. | High | Low |
Free Shipping Progress Bar | Showing a threshold progress bar in-cart motivates users to add more and reduces cart abandonment. | High | Low |
Trust Badges on PDP | Adding trust signals (guarantee, secure checkout, reviews) above the fold reduces hesitation. | Medium | Low |
Express Checkout Prominence | Surfacing Apple Pay / PayPal buttons higher in cart drawer reduces checkout friction. | Medium | Low |
Product Page Social Proof | Adding recent purchase notifications and review counts creates urgency and builds trust. | Medium | Medium |
Simplified Checkout | Removing header/footer navigation focuses the user on completing the purchase. | High | High |